“Why Families Are Getting Good Outcomes”
The Family Development Matrix Outcomes Model / Pathways Project 2012
By Jerry Endres, M.S.W* and Ignacio A. Navarro, Ph.D**
The Family Development Matrix Outcomes Model/Pathway to the Prevention of Child Abuse and Neglect project (FDM Pathway) is funded by the Office of Child Abuse Prevention (OCAP) and is becoming an integral part of the family engagement and assessment processes for 90 family support centers across California. The FDM Pathway is built on the principles of family support and shared across Family Resource Centers (FRCs) that are organized in county collaboratives or tribal communities. This report describes the role of FRCs in using the FDM Pathway process for family assessment and case management, the positive outcomes achieved and interventions used between 2008-2011, and initial findings on the impact of family engagement.
Participating Agencies
The following collaboratives are active participants in the FDM Pathway project: Del Norte, Fresno, Humboldt, Lake, Madera, Orange, San Joaquin, Santa Barbara, Sonoma/Mendocino, San Francisco, San Luis Obispo, Siskiyou, Tehama, Ventura, Yolo.
A survey of participating agencies conducted in 2010 revealed that the majority of family resource centers using the FDM system tend to be relatively young (about 70% were established less than 10 years ago) and are small (59% operates with less than 6 full-time employees). In addition, agencies have a variety of funding sources and diverse structures, but the majority of agencies (65%) were reported to be non-profits (501(c) 3 status).
Even though many types of agencies participate in the FDM /pathways project, most of them identified benefits from their participation. Agency perceptions of their information and evaluation systems revealed that FDM agencies have a more positive outlook on their own systems when compared to similar agencies in a control group that had not used the FDM system. Further, the evaluation found that one of the main factors contributing to the positive perceptions of the FDM system was the increased capacity of participating agencies to show outcome data and their increased ability to produce reports useful to their clients, the community and their sources of funding.
Tracking Family Outcomes
As of June 2011, 5,579 families were assessed using the FDM system. These families reported a total of 12,439 children under the age of 18. Most ethnic groups in California were represented in the FDM: about 19 % of families identified themselves as White, 14% of families identified as African American, and about 57% of families identified themselves as Hispanic. Other ethnic groups included Native Amercans (1.4%) Asian, Pacific Islanders (5%), and mixed (3%). About 1/3 of the familes in the FDM system were reffered by Child Welfare agencies and classified in one of the three Differential Response paths. Out of these 3 paths, the one with the highest representation was Path 2 which involves about about 23% of the total number of families.
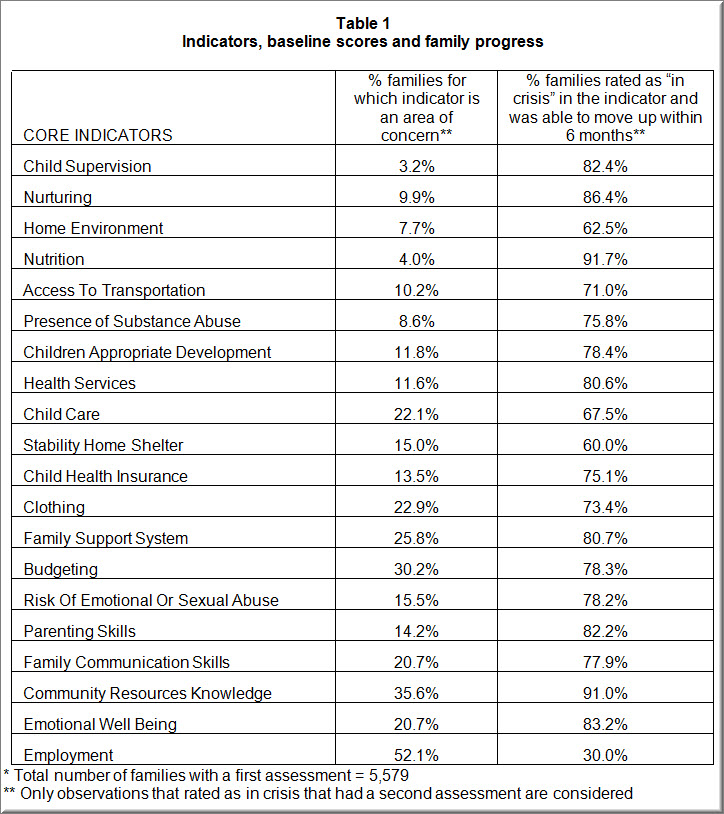
All families in the FDM system were assesssed by a family worker on 20 indicators designed to reflect a comprehensive assesssment of family strengths and areas of concern (see table 1). The data shows the indicators most likely to be rated as areas of concern on the first assesssment are those of employment, community resource knowledge, emotional wellbeing, and health issues. These indicators had a greater percent of families classified as either “in crisis” or “at risk” in their baseline score. However, it is worth mentioning there is a wide range of family situations and distributions of strengths and areas of concern.
As interesting as are the baseline scores, the most striking finding was the significant changes in outcome scores achieved by participating families in the period of time elapsed from their first assessment and their second assessment (between 3 and 6 months). These positive changes serve as testament of the influence of the family support and empowerment focus. As table 1 presents, for all indicators with the exception of employment, 60% of the families that were rated as in crisis in the first assessment were able to move out of that status. The far majority of families (60-80%) moved to “stable” and “self-sufficient” status levels. The greatest gains were observed in the indicators of family communication, child health insurance, child supervision, and parent emotional well being. On the other hand the indicator in which families were most likely to maintain their status or enter into a situation of crisis was that of employment, signaling how difficult it has become to overcome financial instability in the current economic environment.
Explaining positive change in family outcomes
The model underlying the FDM/pathway project suggests that changes in outcomes for a family engaged with a family support agency is a function of three components that make a successful intervention: (1) the case management adequacy, (2) level of family involvement in the intervention, and, (3) the appropriateness of an intervention itself given the family’s specific areas of concern. In the FDM Pathway process the families play a major role during each assessment. They initially identify their situation in a discussion guided by the family worker through the assessment process. After the assessment is entered in the database the next step is a strengths analysis followed by an identification of goals and the steps both the family and the worker will take to achieve it. This family empowerment plan helps to identify and plan to overcome obstacles and challenges, and essentially, both the worker and the family commit to the plan with a set of interventions (services and resources) supporting the family activities.
Interventions
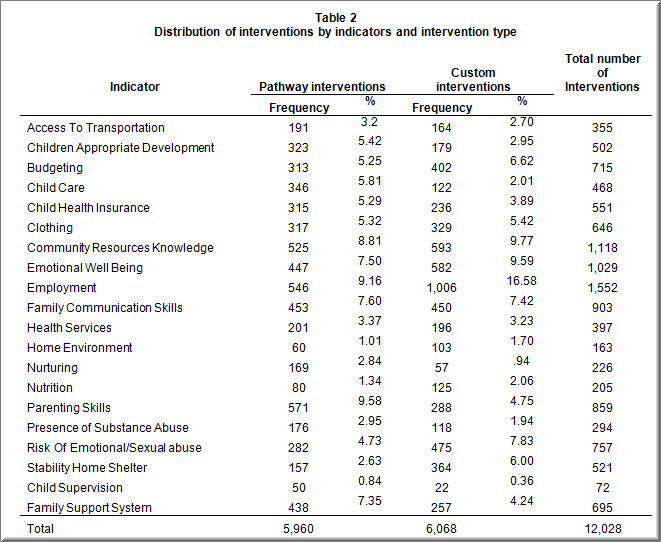
In order to assist families to choose effective interventions, the FDM Pathways project utilizes Harvard University’s “Pathway to the Prevention of Child Abuse and Neglect” interventions and practices. Additionally, each of the 16 collaboratives currently involved in the FDM Pathway project have crafted a set of custom interventions that reflect local resources to meet family needs. As table 2 presents, 12,028 interventions were used with the 5,579 families in the past 3 years. About 50% of those interventions were designed by the collaboratives. More than half of the interventions used were in the areas of Employment, Community Resources Knowledge, Emotional Well Being, Family Communication Skills, Parenting Skills, and Risk of Emotional or Sexual Abuse. These findings are a reflection of existing family needs and agency resources brought together to improve the at-risk situation of families.
Family Engagement
“Setting family goals is a necessary, but not a sufficient practice”
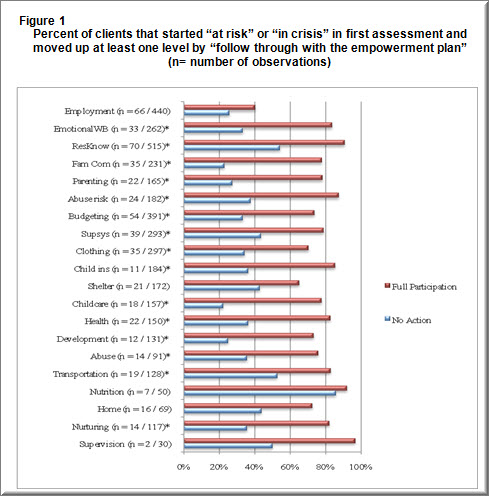
After the development of the family empowerment plan and before subsequent assessments (every 3 months) the worker evaluates family participation. The data showed families committed to following the empowerment plan were more likely to move upward than families that were not so engaged. This information provides strong advice for family support practice: that setting family goals is a necessary, but not a sufficient practice. For positive change to occur, it appears that families need to address the challenges associated with change. As figure 1 depicts, the percentage of families that started in a position of concern and were able to better their situation was greater for families perceived by the worker as being fully engaged in the process than the percentage of families perceived to be resistant to it. The differences were statistically significant across 16 indicators (marked with asterisks).
Future Directions
These preliminary findings about the effects of family engagement and the use of interventions are encouraging and at the same time opens the door for more questions about family change. We plan to pursue FDM Pathway data analysis on this topic to gain greater understanding of what factors contribute to family engagement and how their participation relates to changes in outcomes. More specifically the project will be concentrated on shedding light on:
- Differences in family outcomes by geographical location and demographic factors
- The relationship between the FDM as an early intervention tool in association with cases overseen by child welfare
- Agency factors associated with client attrition and continuity
- The role of family strengths as predictors of outcomes
- Indicator thresholds that families might achieve for positive functioning
- The dynamics of family engagement and its effects on outcomes
- The extent to which the FDM indicators align with Protective Factors and Pathway interventions
- The collaborative relationships between agencies and their impact on family services
We believe our results contribute to showcasing the tremendous work done by family resource centers across California. Agencies and collaboratives are welcome to contact us for more information.